Here is a summary of people's results for NMOS and PMOS process parameters from Labs 1 and 2.  Resuls are sorted by extracted oxide thickness tox:


NMOS
PMOS
Lab group tox [nm]
un [cm2/V.sec] VTH [V] up [cm2/V.sec] VTH [V]
B 52 1001 1.64 143 -0.87
D 60 1370 1.69 285 -1.15
E 60 1123 1.63 181 -1.00
F 61 715 1.27 141 -1.61
J 67 1242 1.57

G 68 1505 1.71 300 -1.21
A 78 1747 1.20 311 -1.70
C 122

141 -1.47
H 281 2091 1.44 673 -1.54

Median 67 1306 1.60 233 -1.34

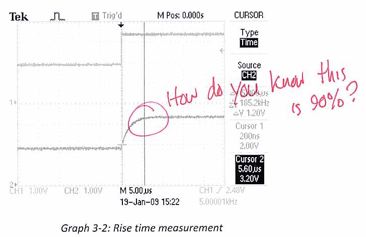
Note two "outliers" in the data, from groups C and H.  One is about 2X too high; the other is about 4X too high.  What happened?  It turns out that measurement errors that seem small can interact and reinforce each other to produce large errors in extracted parameter values.  Let's look at the measurements used to get these parameter values:

Rise Time

It all starts with using too small a vertical scale on the rise time measurement:

Sketchy Rise Time Measurement

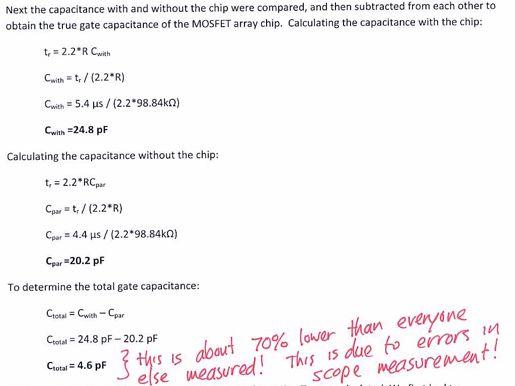
Then things get worse because we need to subtract two numbers to find the difference that gives Cox (and from that, tox):

Subtracting

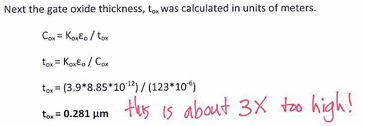
Depending on how the errors in each measurement add, the fraction error in the difference can be VERY large!  And any caluclations based on this erroneous difference will also be in error:

result

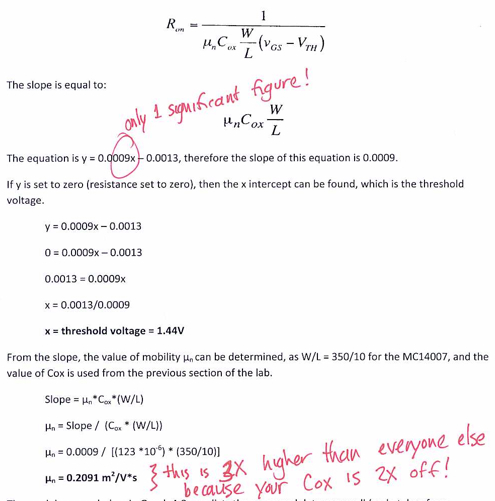
Siginficant Figures


Finally, in Lab 2, the calculations to find µ didn't use enough significant figures (see Lab Pet Peeves for more ranting on this and other Bad Excel Behavior)
Not Enough Significant Figures

The result of all these errors is large errors in the extracted paramters!


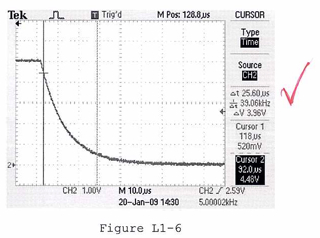
Example of Better Rise Time Measurement

The scope plot below shows an example of better use of the oscilloscope scale - see Rise Time Measurement Tips for more details
Better tr Measurement